Physicist: Feynman diagrams are primarily a way to keep track of what you’re doing. Physicists aren’t geniuses or anything, and they get distracted pretty easily.
When you’re trying to calculate the probability of a particular particle interaction you’ll find yourself integrating over (adding up) every possible position and momentum of every involved particle. Moreover, when there are several different ways that you can get a particular result you need to keep track of all the different ways that the result can happen.
Feynman diagrams are not technically necessary, but they do help you keep track of variables and permutations. It turns out that particle physics is a lot more complicated than you’d think. That holds true even if you think it’s really, really complicated.
Feynman diagrams were created alongside the field of quantum electrodynamics and (as far as I know) no one has suggested another diagram system (if it ain’t broke…). They allow you to write down the important integrals in the form of a picture, which makes them far more understandable to just about anybody.
Ultimately, once a diagram has been made, and an integral is created and evaluated from it, you end up with the probability amplitude of that particular particle interaction taking place.

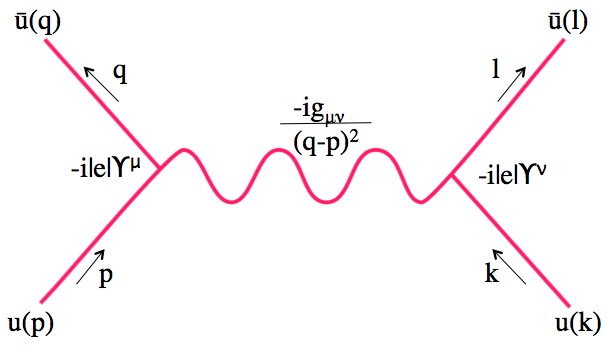
The Feynman diagram for the Coulomb interaction (electric force), along with the parts of the Feynman integral they correspond too. Every part of this is really nasty. For example, that "g" is actually 16 numbers.
The electric force (what physicists call the “Coulomb force” to look smart) is mediated by photons. That is to say, particles with charge push or pull on each other using photons. The diagram above is the “first order Feynman diagram” for two electrons repelling each other. The probability amplitude of two electrons with momentum p and k pushing off of each other and flying off again with momentum q and l is given by:
The squiggly line is the exchanged (virtual) photon and the solid lines are the electrons. The diagram generally represents time as the vertical direction and space as the horizontal, but it turns out that on extremely short time and distance scales it’s not super important.
If you’re wondering which particles are virtual and which are real: virtual particles are the ones stuck inside the diagram and real particles are the ones going in and coming out (they might go on to be detected somewhere).
The reason this is a “first order” diagram is because this isn’t the only way this interaction can happen, merely the most likely. The less likely interactions are also all happening at the same time, they just have less weight. Super-positions and whatnot. Quantum mech is good fun.

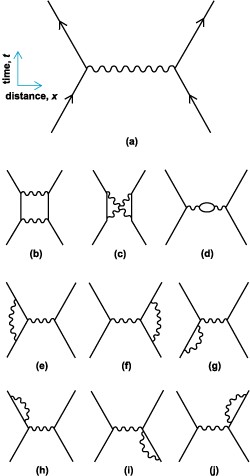
There are a lot of ways this interaction could have gone down, and each one has it's own equation (many are very similar). The diagrams help you to keep track of which one is which.
The more complicated an interaction is, the less likely it is, and the less it adds to the total probability amplitude. In the above picture:
b,c) What if two photons are exchanged instead of just one?
d) What if the exchanged photon creates a virtual electron/positron pair en route?
e,f) What if one of the electrons has a virtual photon “up in the air” during the photon exchange?
g,h,i,j) What if one of the electrons emits and reabsorbs a virtual photon right before or after the exchange?
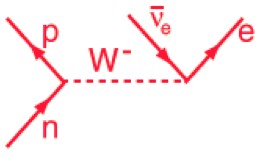
Feynman diagrams apply to a lot more than just electromagnetic interactions. For example; neutron decay! For some reason this is the third mention of neutron decay on this website (1 and 2).

A neutron spontaneously emits a virtual W-boson which goes on to turn into an electron and anti-electron neutrino.
Unfortunately, if you really want to learn how to use Feynman diagrams you should get a BS in physics and then take several classes in quantum field theory in grad school. This stuff is crazy hard.


Pingback: Forget to post | An Australian in America